The EU wants to kill cookie bannersThe EU wants to end annoying cookie pop-ups by letting users set their consent once in their browser. If passed, websites will have to respect those choices. Nov 20, 2025
Google is tracking you (even when you use DuckDuckGo)Google tracks users even on DuckDuckGo via Analytics and embeds. A new study shows how deep Google’s web tracking really goes. Jul 14, 2025
German court rules Meta’s tracking tech violates GDPRGerman court rules Meta’s tracking tech violates GDPR, allowing lawsuits without proof of harm. Big risks ahead for sites using Meta pixels. Jul 10, 2025
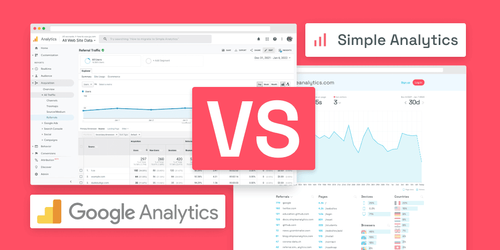
Simple Analytics as an alternative to Google AnalyticsWhat are the differences between Simple Analytics and Google Analytics, and why is Simple Analytics a great alternative. Jan 7, 2022
Cookieless website analyticsDetailed guide on cookieless website analytics and how to use GA4 without cookies. Mar 22, 2022
Practical privacy tips for your businessAs the founder of a privacy-first analytics tool, I'm sharing my practical privacy tips for your business. May 28, 2020
Why its time to move away from Google AnalyticsGoogle Analytics is banned in some EU member states and more are likely to follow. Here is to why you should remove Google Analytics today. Jul 5, 2022
Closing the data gap - Simple Analytics x UsercentricsHebban fixed a 20% GA4 data gap using Simple Analytics + Usercentrics. Here’s how you can do the same. Jun 24, 2025
The EU-US data deal may be dead in the waterThe EU-US data deal is at risk. US cloud services may soon be illegal in the EU again. Mar 11, 2025


&url=https%3A%2F%2Fwww.simpleanalytics.com%2Fblog%2Fgoogle-is-tracking-you-even-when-you-use-duck-duck-go&author-slug=iron-brands)